Get started
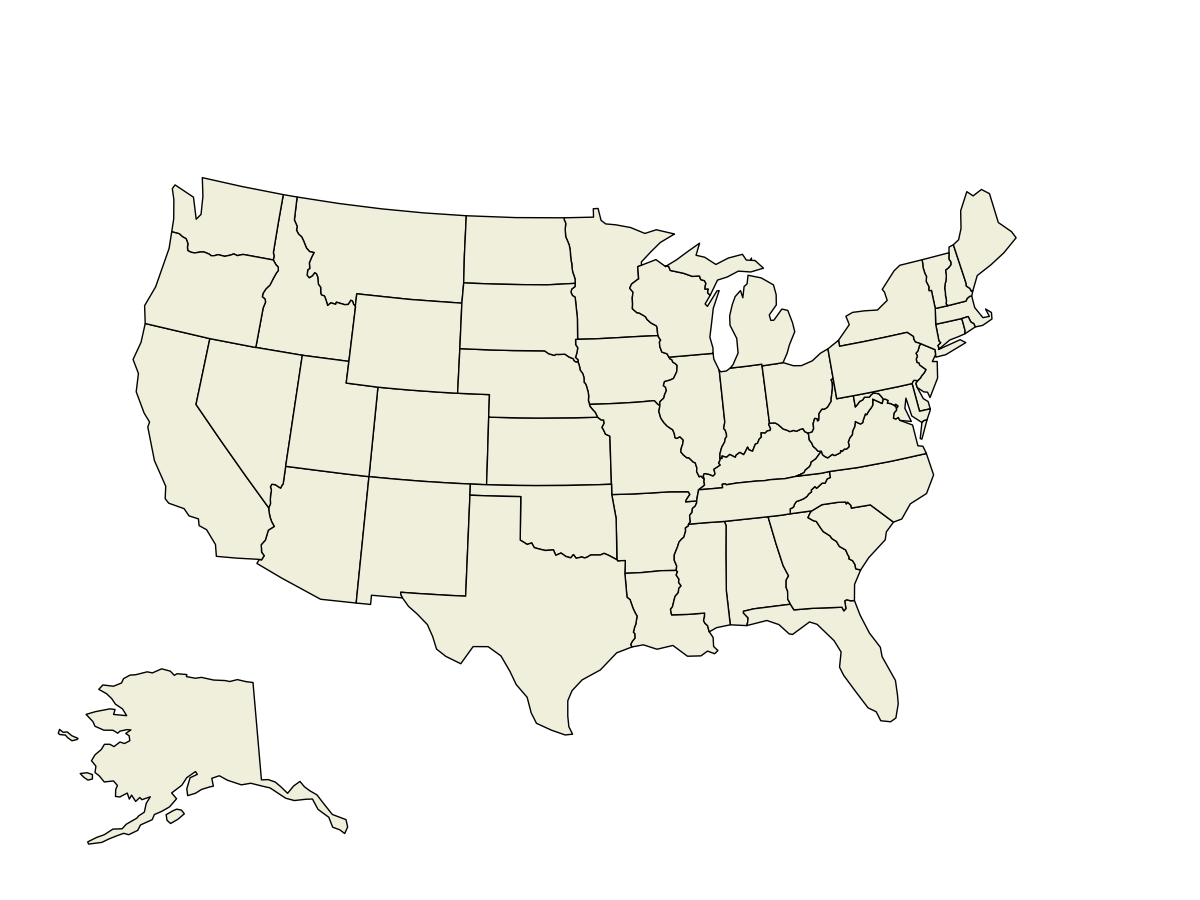
Let’s get started by creating the StaticMap object, to which we will be adding all elements. We probably need to specify the view span as well as the central longitude, and we might want to choose a projection and maybe add some borders:
import oneworld as ow
mymap = ow.StaticMap(view = [-125, -66.5, 20, 50],
                     central_longitude = -98.6,
                     projection = 'AlbersEqualArea',
                     inner_borders = ['USA'])
To display the map, we can save it to an image file using:
mymap.savemap('tutorial.png')
Which renders the following image:

By default, each time we create a StaticMap the algorithm creates a new figure where to place the map. We can request to plot the map in an existing figure, thus having the option to add inserts in the map:
myinsert = ow.StaticMap(position = [0, 0, 0.3, 0.3], create_fig = False,
                        view = [-175, -130, 50, 73],
                        central_longitude = -150,
                        projection = 'AlbersEqualArea',
                        inner_borders = ['USA'])
This adds an insert in the previously created map:
In this case we have specified the position of the insert through the position argument, and set it to the bottom left of the figure with a width and a height equal to one third of the total width and height of the figure.
Note
You might get a UserWarning when adding some elements regarding the
tight_layout function, which is applied by default when
calling the savemap method. If the map is not displayed
properly, or f you feel unconfortable getting this warning,
you can always
deactivate the tight_layout by specifying
tight = False when calling the savemap method.
Now that we know how to plot basic maps, it’s time to add some more elements to our map.
Note
In all the examples of the following sections, the savemap line is omitted for clarity.