Shapefiles and choroplets
Let’s start,as always, by creating our StaticMap object:
import oneworld as ow
mymap = ow.StaticMap(view = [-125, -66.5, 21, 50],
                     central_longitude = -98.6,
                     projection = 'AlbersEqualArea')
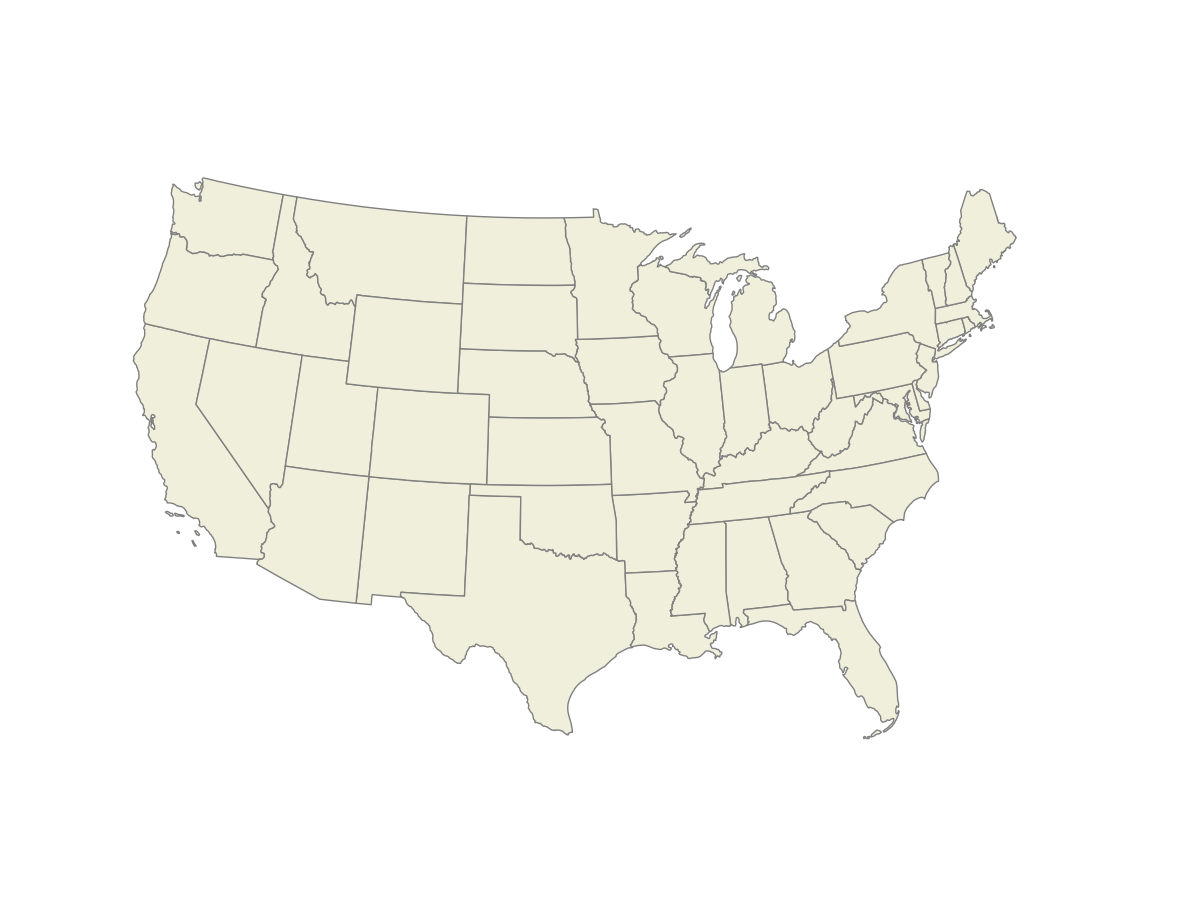
This time we don’t request any borders so that they don’t interfere with the polygons we will be adding. To add the polygons contained in a shapefile, we can use the add_shapefile method once the map has been created:
mymap.add_shp(shp_file = 'us_state_20m.shp', edgecolor = 'grey')
We only need to state the name of the shapefile (us_state_20m.shp in this case), but we have also added the edgecolor keyword for extra flavor (add_shp accepts the standard matplotlib keywords for plot aesthetics). After saving the image, we obtain the following map:
If we want to include in our map only those polygons in the shapefile whose attribute named “STUSPS” has a value of “CO”, we can use the subset and shp_key keywords:
mymap.add_shp(shp_file = 'us_state_20m.shp', edgecolor = 'grey',
              subset_key = 'STUSPS', subset = 'CO')
Which gives the following map:

Since only one polygon in the shapefile fulfills our requirement, only one polygon has been added. Note also that since we did not request any border to be plot when creating the StaticMap object, the figure only shows the polygon selected.
To color each of the polygons in the shapefile according to some value, i.e. to create a choropleth, the add_choropleth can be used, since it is its only purpose. Let’s add the polygons from the same shapefile of the previous examples, and color them according to theeir value in the column “Region” in the dataframe of a preloaded dataset:
df = ow.load_dataset('farms')
mymap.add_choropleth(shp_file = 'us_state_20m.shp', data = df,
                     shp_key = 'GEOID', geoid = 'FIPS', color = 'Region',
                     edgecolor = 'grey')
After saving the map, we obtain the following image:
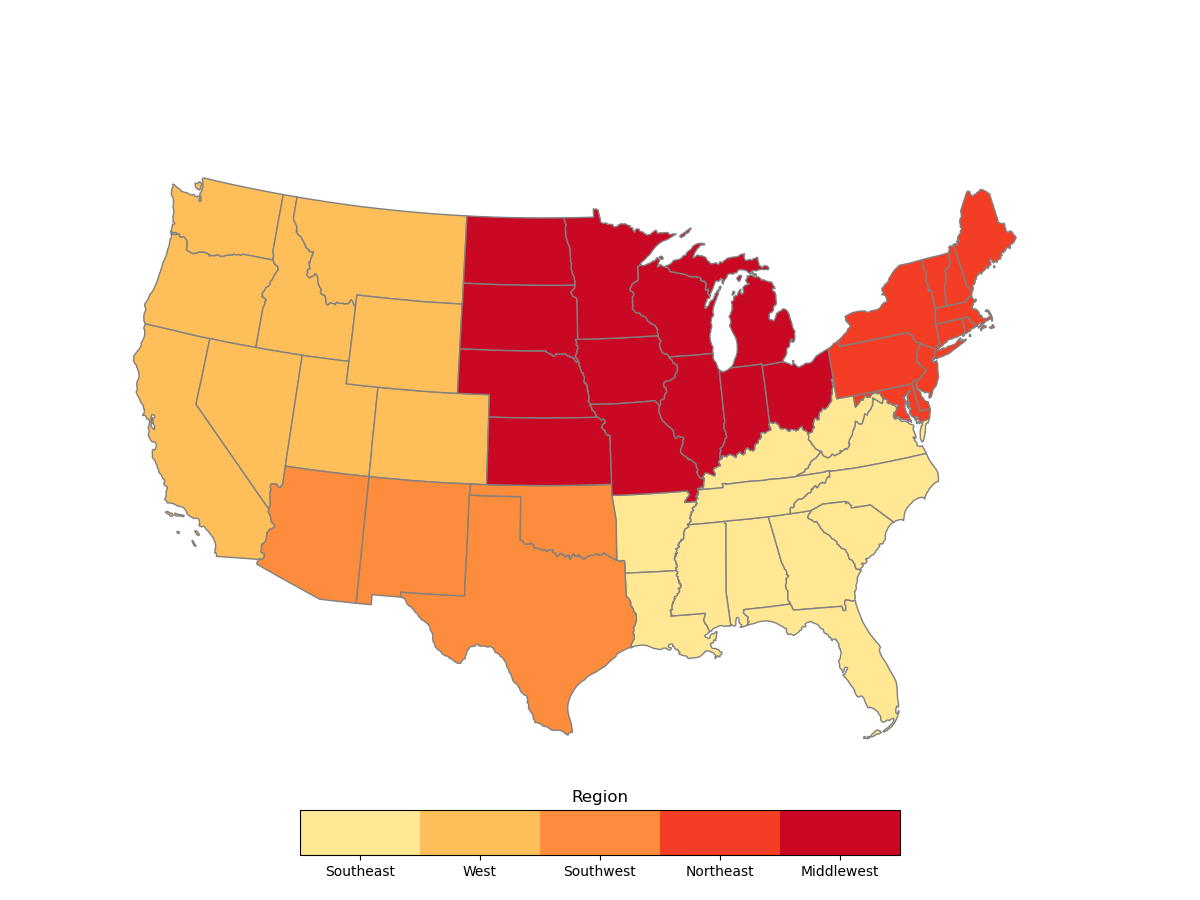
The add-choropleth method uses the “FIPS” column of the dataframe “df” to uniquely identify each polygon in the shapefile through the “GEOID” attribute, and then colors it according to the value found in the “Region” column of the “df” dataframe.
The color keyword accepts both categorical and numeric data:
mymap.add_choropleth(shp_file = 'us_state_20m.shp', data = df,
                     shp_key = 'GEOID', geoid = 'FIPS',
                     color = 'Land in farms',
                     palette = 'YlGn', n_colors = 8, edgecolor = 'grey')
